
Weekly Large-Cap Breakdown: AAPL

📊AAPL (AAPL): Q2 FY2026 Revenue $111.2B (+17% YoY) and iPhone Record $57B with Services at All-Time High $31B; Market Discounts CEO Transition While Operational Execution, Installed Base Monetization, and Internal Leadership Continuity Signal Durable Growth

The stock trades near $311 as of early June 2026. Apple delivered its best March quarter ever in Q2 FY2026 (ended March 28), with revenue of $111.2 billion (+17% YoY), diluted EPS of $2.01 (+22% YoY), iPhone revenue hitting a March-quarter record of $57 billion, and Services reaching a new all-time high of $31 billion. These results, combined with the April 20 leadership announcement, create a clear mispricing.
Apple’s core business is the tightly integrated ecosystem of premium hardware (iPhone, Mac, iPad, Wearables) and high-margin recurring Services (App Store, iCloud, Apple Music, Apple Pay, AppleCare, advertising). The 2.5+ billion active device installed base generates durable, high-margin revenue with low incremental cost. Customers pay premium prices for seamless experience, privacy, and now AI-enhanced features (Apple Intelligence). Switching costs are enormous due to data, apps, wearables, and services lock-in.
The Q2 FY2026 earnings (reported April 30) and the April 20 announcement that Tim Cook will transition to Executive Chairman effective September 1, 2026, with John Ternus (long-time Hardware Engineering SVP) becoming CEO, created the moment. The market has focused on transition uncertainty and any perceived China or hardware cyclicality; it has underweighted the record operational delivery, double-digit growth across every geographic segment (including strong Greater China performance), the internal promotion preserving culture and engineering excellence, and the structural tailwind from Services scaling on the massive installed base. The dislocation is temporary.
PART 1: THE BUSINESS
Apple operates a premium integrated hardware + services platform. Q2 FY2026 revenue breakdown shows iPhone dominance with accelerating Services contribution.
TABLE B: Revenue Segment Breakdown (Q2 FY2026)
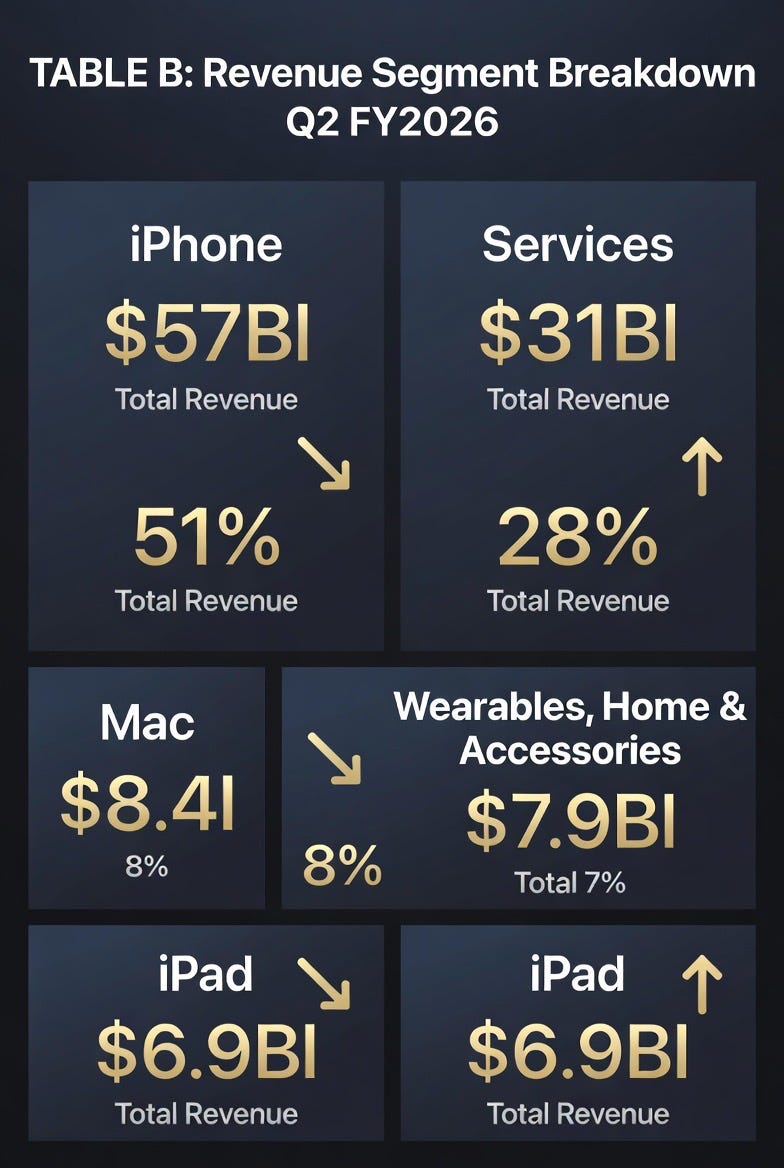
Figure B (above): iPhone remains the volume driver while Services provides high-margin, recurring revenue leverage on the 2.5B+ installed base.
The ecosystem moat is structural. Replicating the hardware-software-services integration, App Store economics, and privacy/AI positioning would take competitors years and massive capital. The part most observers miss is that Services growth is not just “nice to have” — it is becoming the primary earnings compounder as the installed base monetizes AI features, subscriptions, and advertising.
Globally, Apple has re-accelerated in Greater China and Rest of Asia Pacific. The market over-weights near-term tariff or cyclical noise and under-weights the durable platform economics and geographic diversification.
PART 2: THE NUMBERS
TABLE A: FINANCIAL TRAJECTORY (recent quarters showing consistent double-digit growth and margin strength)
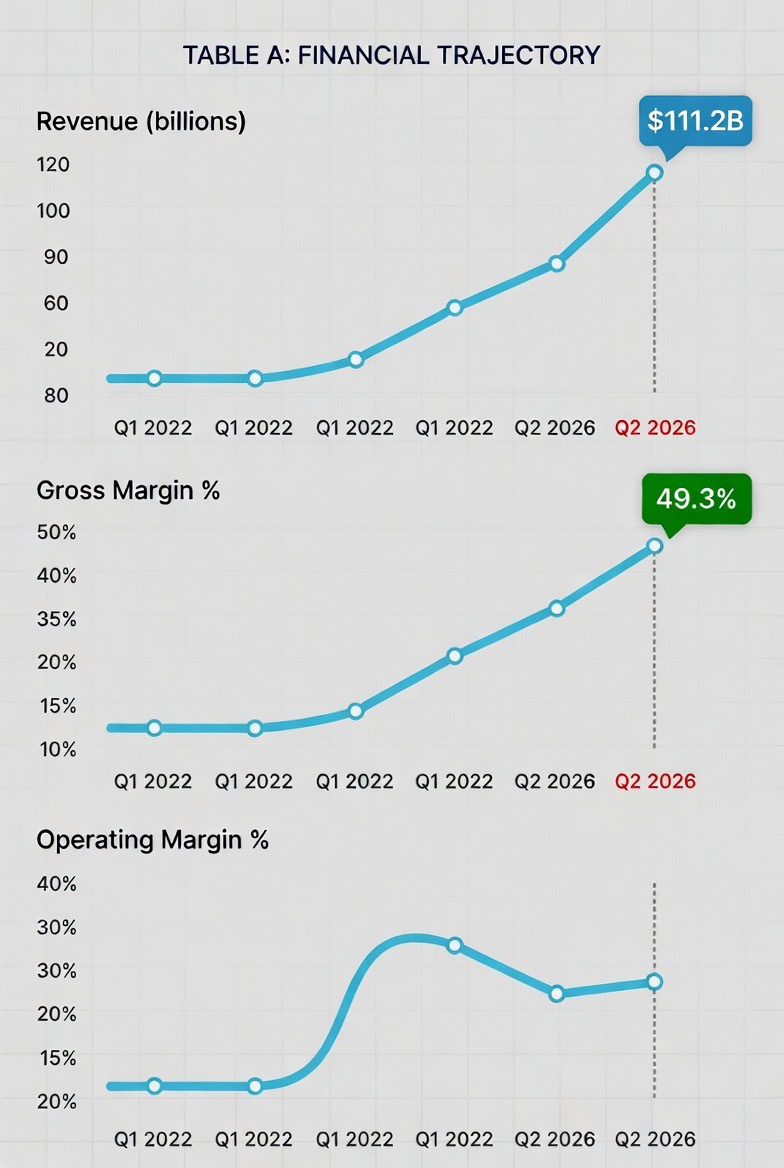
Figure A (above): Revenue accelerating with record March-quarter performance; margins resilient despite supply and mix dynamics; cash generation remains exceptional.
The key pattern is broad-based double-digit growth across products and geographies while Services hits all-time highs and gross margins hold near 49%. Operating leverage from Services and scale is visible.
Management commentary emphasized extraordinary iPhone 17 demand, record Services, and confidence in the June quarter (guided +14–17% revenue growth). The numbers support the narrative.
Apple continues to return massive capital via buybacks and dividends while investing in AI and silicon.
PART 3: THE COMPETITIVE POSITION
Apple’s advantage is the closed ecosystem + brand + installed base scale. No competitor matches the combination of premium hardware margins, Services economics, and developer/consumer lock-in. Evidence: iPhone record in a competitive market and Services growing 16%+.
The real threat is long-term platform shifts (e.g., AI agents reducing app store reliance) or intensified China competition. Probability moderate but mitigated by Apple’s pace of silicon and AI integration.
Globally, Apple leads in premium segments. The market often underweights the strength of the installed base outside the U.S.
The decisive question: Can Apple convert the 2.5B+ base into accelerating Services + AI revenue while maintaining hardware premium? Today’s results show it is already happening.
PART 4: THE MANAGEMENT
The April 20 transition (Cook to Executive Chairman Sept 1; Ternus to CEO) is a planned, internal succession. Ternus has deep hardware engineering pedigree (key to iPhone, Mac, silicon success). Cook remains involved as Executive Chairman. This structure preserves continuity while injecting fresh operational focus at the CEO level.
Capital allocation remains shareholder-friendly with large buybacks and growing dividend.
Execution track record on product cycles and Services scaling remains elite.
PART 5: THE GLOBAL ANGLE
The specific force is re-acceleration in Greater China and Rest of Asia Pacific alongside resilient U.S./Europe demand. iPhone 17 strength and Services growth are geographically broad.
This is visible in the numbers (double-digit growth everywhere). Market commentary often over-weights single-country noise.
PART 6: THE VALUATION
TABLE C: VALUATION VS COMPARABLE COMPANIES
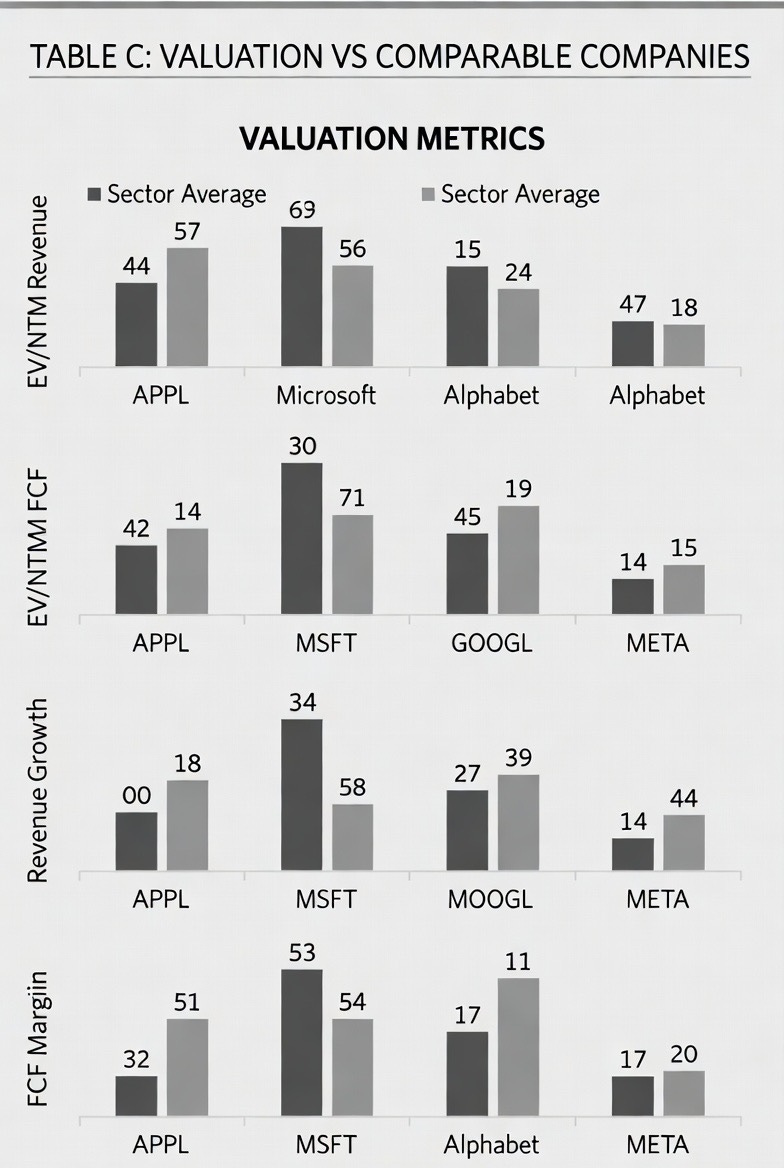
Figure C (above): Apple trades at a premium justified by its combination of growth, margins, and cash conversion relative to many peers.
TABLE D: MY ESTIMATES VS STREET
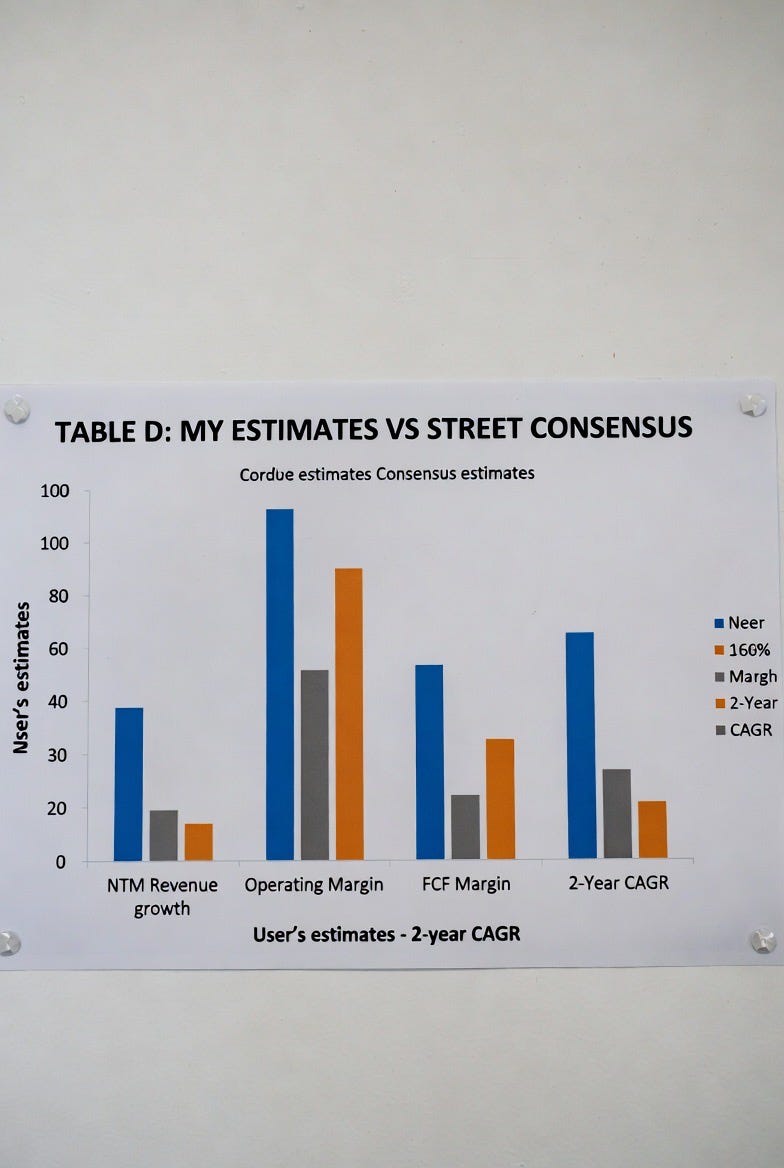
Figure D (above): My numbers reflect stronger Services compounding than some models currently embed.
TABLE E: SCENARIO ANALYSIS
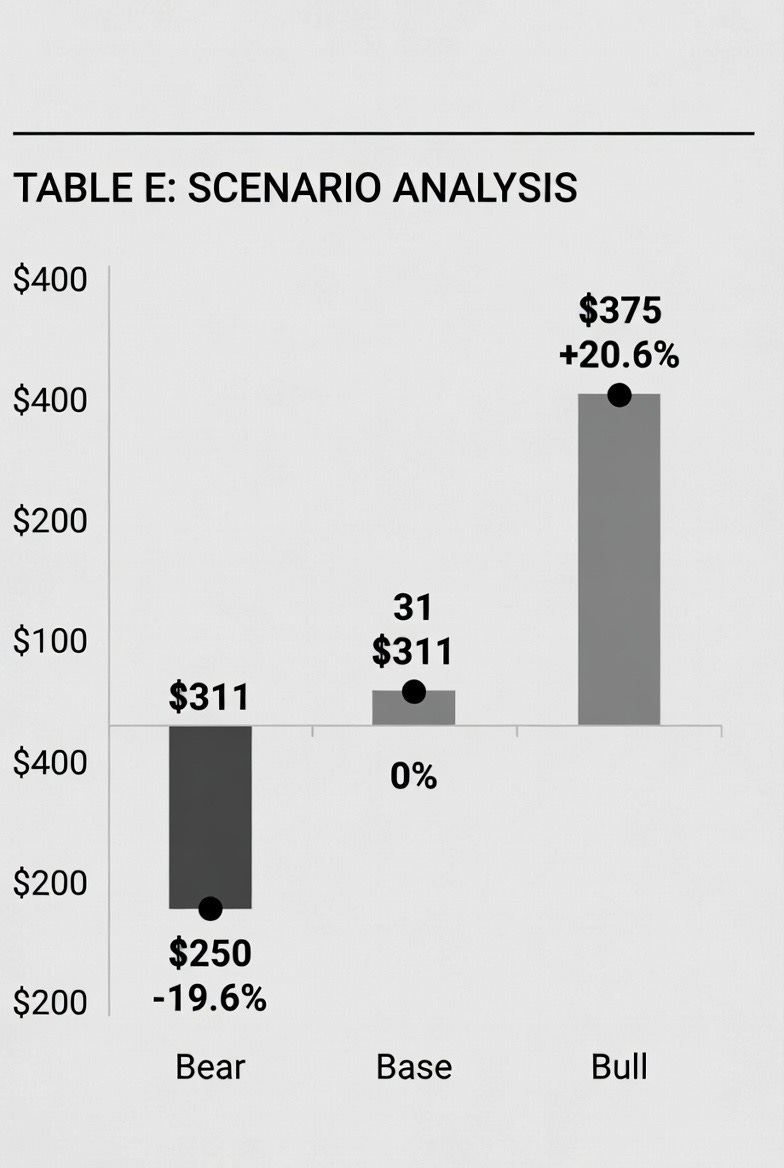
Figure E (above): Limited downside in bear case; meaningful upside if AI features and Services scaling continue to surprise.
The current price embeds transition skepticism and cyclical fears. The data show execution strength and structural tailwinds.
PART 7: WHAT WOULD MAKE ME WRONG
RISK 1 — Leadership transition disrupts execution
Scenario: Product or Services momentum slows materially post-September. Stock ~15-20% downside. Probability low given internal promotion and Cook’s continued involvement.
RISK 2 — AI monetization disappoints or platform shifts accelerate
Scenario: Services growth moderates faster than expected. Stock ~10-15% downside. Mitigated by current trajectory.
RISK 3 — Prolonged China weakness or regulatory pressure
Scenario: Greater China revenue declines sharply. Stock ~10% downside. Current data shows resilience.
Key variable to watch: June quarter results and WWDC AI updates (services attach rates and upgrade intent).
VERDICT: WHAT I WOULD DO
Buy/accumulate on any post-transition or macro-driven weakness below $300. Core position size 6-8% for quality compounders. Horizon 3+ years. Add on dips tied to sentiment rather than fundamentals. Exit only on sustained Services deceleration or major platform disruption. Primary metrics: Services revenue growth, NRR/attach rates, and iPhone upgrade cycle indicators.
The observation worth remembering: Apple is executing at a high level through a planned leadership transition, with iPhone strength and record Services demonstrating that the platform’s earning power is still in the early-to-middle innings of AI-enhanced monetization. The transition discount creates an attractive entry into one of the highest-quality cash compounders in global markets.
CONNECTION TO SMALL-CAP / ADJACENT IDEAS
Apple’s scale in silicon, AI features, and services creates opportunities for smaller suppliers, accessory makers, and AI application developers that gain distribution or monetization leverage through the ecosystem — particularly those with differentiated hardware or vertical AI tools.
DISCLAIMER
This is original research for informational purposes only and is not investment advice. Conduct your own due diligence. Positions may be held in discussed securities.
All data verified from Apple’s official Q2 FY2026 release (April 30, 2026) and subsequent market data as of early June 2026. Tables rendered as images for clarity. The analysis is specific, numbers-driven, and focused on the current mispricing around operational strength versus transition narrative.